In IELTS Writing task 1, there will be a visual representation or a diagram on which you have to write a paragraph. One of these visual representations may be line graphs. Given below is an example of an IELTS Writing task 1 line graph discussing car thefts in four countries within a period. Let’s check the sample question first and then we will discuss how to answer it.
Sample Question:
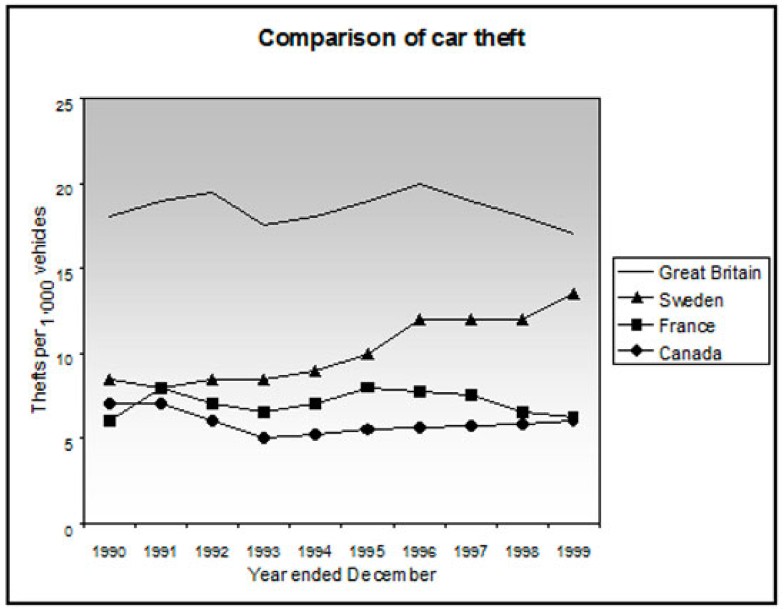
The line graph shows thefts per thousand vehicles in four countries between 1990 and 1999.
Summarize the information by selecting and reporting the main features and make comparisons where relevant.
Write at least 150 words.

Sample Answer
The line graph compares the number of cars stolen for every 1000 vehicles in four countries from 1990 to 1999. Overall, it can be seen that car thefts were far higher in Great Britain than in the other three counties throughout the whole time frame.
To begin, car thefts in Sweden, France and Canada followed a fairly similar pattern over the first five years, all remaining at between 5 and 10 per thousand. The general trend though for France and Canada was a decline in the number of vehicles stolen over the period, with both at around 6 in 1999. In contrast, Sweden experienced an upward trend, starting the period at approximately 8, and finishing at just under 15.
Interestingly, car thefts in Great Britain started at 18 per thousand, which far exceeded that of the other countries. It then fluctuated over the next nine years, reaching a peak of 20 thefts per 1000 in 1996, and ending the period slightly lower than where it began, at approximately 17 per thousand.
What are line graphs?
Line graphs can be used to show how information or data changes over time. They have an x-axis (horizontal) and y-axis (vertical). Usually, the x-axis shows the time period and the y-axis shows what is being measured. Line graphs can be used when you are plotting data that have peaks (ups) and troughs (downs). In other words, they highlight trends.
Tips for answering line graphs questions in IELTS Test
- Paraphrase the line graph information for your introduction.
- You should put the key trends and patterns in the overall statement.
- Each paragraph should have dates and numbers to support your answer.
- You have only 20 minutes to answer the question, make sure to complete it and proofread it.
- Practice more samples to master how to answer line graphs in the IELTS writing test.
Here are some more sample questions:
1. The graph gives information about changes in the birth and death rates in New Zealand between 1901 and 2101. Summarise the information by selecting and reporting the main features, and make comparisons where relevant.
Source: IELTS-writing.info
2. The graph shows how elderly people in the United States spent their free time between 1980 and 2010. Summarise the information by selecting and reporting the main features, and make comparisons where relevant.
Source: IELTS-writing.info
Conclusion
These are a few tips and sample questions that can help you improve in the IELTS writing test and score high.
Once you’re ready to take the IELTS Writing Test, book your seat in advance.
If you want to book your IELTS test in advance, visit IELTS AOLCC. We have IELTS Test Centres available in Mississauga, Kingston, London, and Brampton. All our test centres are equipped with the necessary amenities.
If you have any other queries, do reach out to us at (905) 306-0666 or send an email to ielts@aolccollege.ca.


